Products
Stoxxtop.com - Chart Patterns
Brokers
Trading Software
Analysis
Chart Patterns
Metastock Software
News Sources
Trading Articles
Technical Analysis
Technical Analysis Charts
Useful Links
Tools
Pivot Points
Fibonacci Retracement
Fibonacci Upside Projection
Fibonacci Downside Projection
Position Sizing
Financial Videos
Guidance
Herd Mentality
News Trading
Price Forecasts
Psychological Balance
Self Discipline
Your Trading Plan
About
About Us
Contact Us
Disclaimer
Imprint
Privacy
Wednesday, July 15, 2026
☰
Home
Chart Patterns
Trading Articles
Technical Analysis
Technical Charts
Useful Links
Chart Patterns
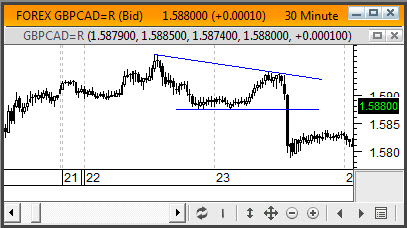
The Descending triangle Pattern
The descending triangle is a bearish formation that usually forms during a downtrend as a continuation pattern and indicates distribution. Once the horizontal line has been broken, the downside target
Full Description